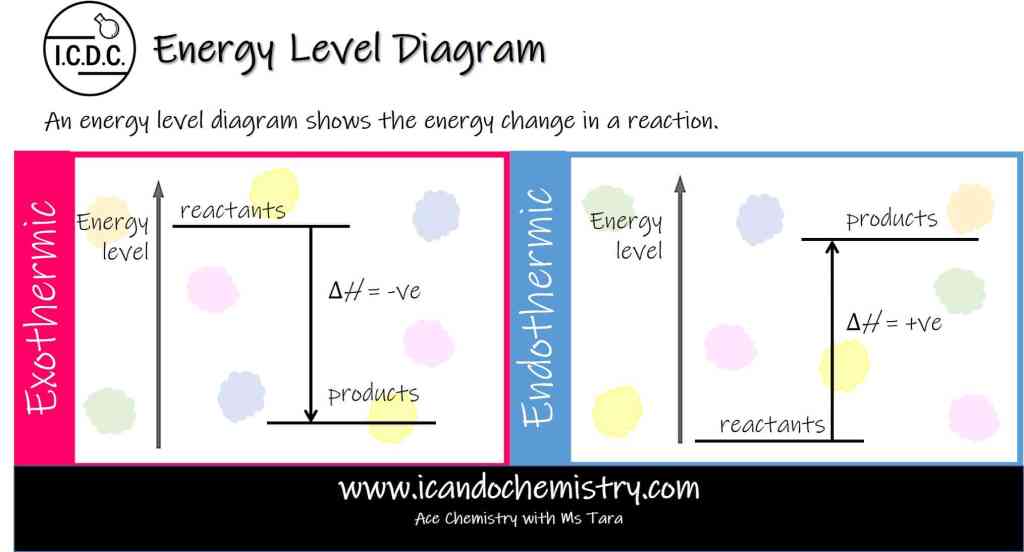
An energy level diagram shows the energy change in a reaction.
Enthalpy change, ΔH, represents the difference in energy content of the reactants and products. It is measured in kilojoules (kJ).
Energy Level Diagram for an Exothermic Reaction
In an exothermic reaction, heat is given out to the surroundings. The total energy of the products is less than that of the reactants. Hence, the enthalpy change, ΔH, is negative. This is represented by an energy level diagram. The difference between the energy levels of the products and the reactants is equal to the amount of energy given out during the reaction.
We draw an arrow down to represent the loss of energy. The arrow must touch the energy level of reactants and products.
Energy Level Diagram for an Endothermic Reaction
In an endothermic reaction, heat is absorbed from the surroundings. The total energy of the products is more than that of the reactants. Hence, the enthalpy change, ΔH, is positive. This is represented by an energy level diagram. The difference between the energy levels of the products and the reactants is equal to the amount of energy taken in during the reaction.
We draw an arrow up to represent the gain in energy. The arrow must touch the energy level of reactants and products.

You ought to take part in a contest for one of the highest quality websites on the web. I most certainly will highly recommend this blog!
LikeLike